Information on Spectral Irradiance Data

The radiometric data shown at the end of this section was measured in our Standards Laboratory. The wavelength calibrations are based on our spectral calibration lamps. Irradiance data from 250 to 2500 nm is based on an NIST traceable calibrated quartz tungsten halogen lamp. We validated the measurements using calibrated detectors. We used a calibrated deuterium lamp for wavelengths below ~300 nm. In both cases, we use interpolation to infer the irradiance of the calibrated lamp at other than the discrete NIST calibration wavelengths. We measured each of the lamps to be calibrated, in the most favorable orientation.
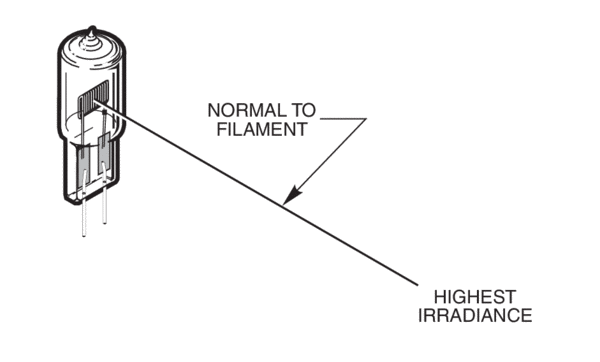
Figure 1. QTH lamps with dense flat filaments have highest irradiance along the axis normal to the filament plane through the filament center. We orient the arc lamp so the seal-off tip and, in some cases, the starter wire does not interfere with the measurement.

The lamps are operated vertically and the measurement is made in the horizontal plane through the center of the radiating filament or arc. The lamps are rotated for maximum flux at the measurement site. This is particularly important for our planar filament quartz tungsten halogen lamps. At 0.5 m the flux density of all our lamps is uniform over at least a 25 x 25 mm2 area. As you move out of the plane but still maintain the same 0.5 m distance and face the source, the recorded power should in principle fall according to Lambert’s Law for a planar source and remain constant for a point source. Measurements show something in between, with the arc lamps resembling point sources up to the electrode shadowing limit.

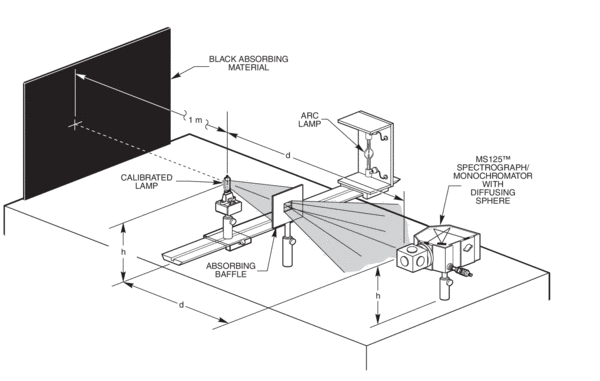
Figure 2. Set-up for a radiometric measurement.

As you change the measuring distance from 0.5 m, the irradiance follows the inverse square law providing the distance, d, is larger than 20 to 30 times the radiating element size. The shortest distance we use in our measurements is 300 mm.

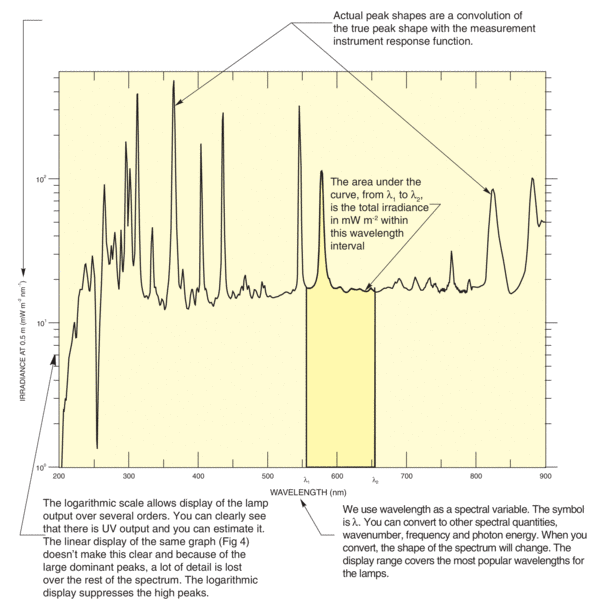
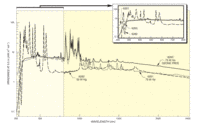
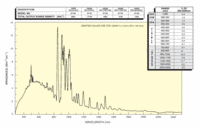
Figure 3. Example of the spectral irradiance curves we show for our arc, quartz tungsten halogen, and deuterium lamps.

Working with Semi-Log Displays

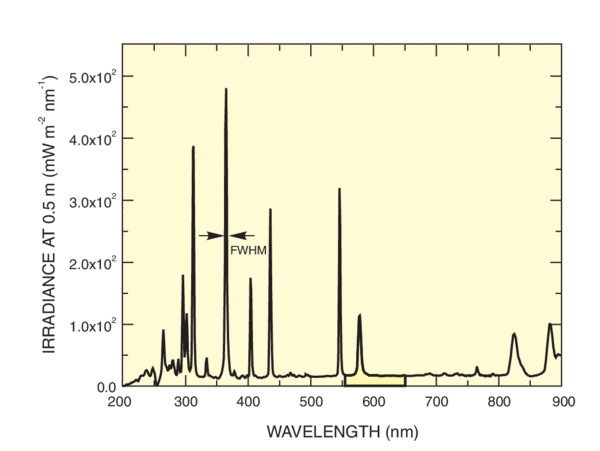
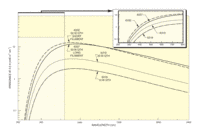
The advantage of the semi-log display is the range our graphs cover, from very low levels to large peaks. Fig. 4 shows the linear display of the graph shownin Fig. 3. You get a much better sense of the height of the peaks, but the values at lower levels are lost.

Figure 4. Linear display of the graph shown in Fig. 3.

The logarithmic compression can be deceptive when it comes to estimating the area under a portion of the curve, to determine the total irradiance from λ1 to λ2, for example. You cannot rely on a rapid visual comparison unless you remember that the area at the bottom must be discounted appropriately. The peaks are much more important than they seem! So, you should calculate the area using the data values you read from the curve.

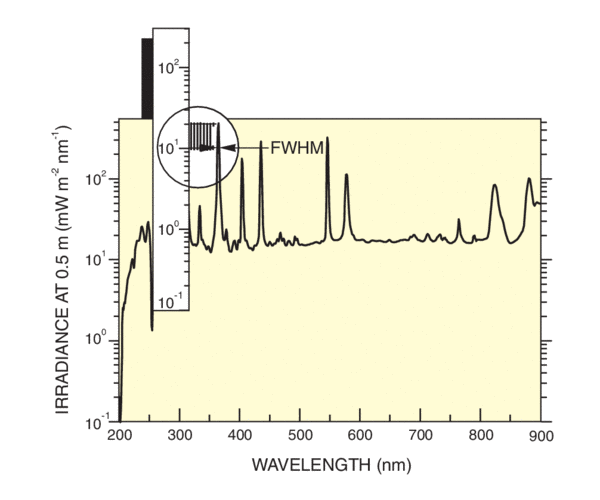
The logarithmic scale complicates estimation of the amount of irradiance in any peak. The half maximum is no longer halfway between the peak top and the bottom of the graph. You can easily find the half maximum by measuring the distance from 1 to 2, or 10 to 20, etc., on the logarithmic axis scale. Moving down this distance from the peak locates the half maximum (Fig. 5). We discuss the spectral peaks in the discussion on see Calculating Output Power

Figure 5. Calculating the FWHM from a log graph.

How Good is the Data?

We measured the irradiance data on all our lamps using both multichannel detectors with our MS257™ Spectrograph, and scanning monochromators. We used integrating spheres for most of the measurements. This effectively averages the polarization of the incoming radiation. Stress birefringence in the arc lamps and the filament structure of the lower power QTH lamps cause noticeable polarization of the output that may enhance or detract from your application.

We have a high degree of confidence in our data and cross check them with full radiant power meters and calibrated filters. The measurements are of lamps early in their life, operated in open air. Thermal conditions are different for lamps operated in lamp housings, and the spectral distribution changes slightly as the lamps age. Mercury lamps are particularly sensitive to thermal changes.

We see ±15% variation in output from lamp to lamp even within the same batch of lamps. We see substantially more variation in the UV output (

In short, we believe that this set of data is the most comprehensive and reliable you will find for lamps of this type and are an excellent resource for first estimates. But don't base a tightly toleranced system design on the data without additional characterization of the lamp in its intended operating environment.

Finding the Right Spectral Irradiance Curve

Refer to Table 1 to find the model of a lamp you are interested in. You can then click on the model for the spectral irradiance graph and additional information and specifications.

Table 1 UV-IR Radiation Sources

Model Lamp Type Wavelength Range Type/Wattage
63162 Deuterium ~160 to 400 nm 30 Watt Deuterium Lamp, 1 mm Arc
63163 Deuterium ~160 to 400 nm 30 Watt Deuterium Lamp, 0.5 mm Arc
63165 Deuterium ~160 to 400 nm 30 Watt Deuterium Lamp, 0.5 mm Arc, Ozone Free
6251NS Xenon 200 to 2500 nm 75 Watt Xenon Arc lamp
6247 Xenon 200 to 2500 nm 75 Watt Xenon, High Stability Arc Lamp
6263 Xenon 200 to 2500 nm 75 Watt Xenon Arc Lamp ( Ozone Free)
6257 Xenon 200 to 2500 nm 100 Watt Xenon, Ozone Free Arc Lamp
6255 Xenon 200 to 2500 nm 150 Watt Xenon Arc lamp (Ozone Free)
6254 Xenon 200 to 2500 nm 150 Watt Xenon, UV Enhanced Arc lamp
6256 Xenon 200 to 2500 nm Xenon Arc Lamp, 150 W
6258 Xenon 200 to 2500 nm 300 Watt Xenon Arc lamp (Ozone Free)
6267 Xenon 200 to 2500 nm 500 Watt Xenon Short Arc Lamp, Ozone Free
6271 Xenon 200 to 2500 nm 1000 Watt Xenon Arc lamp (Ozone Free)
62711 Xenon 200 to 2500 nm 1600 Watt Xenon, Ozone Free Arc Lamp
6427 Pulsed Xenon 200 to 2500 nm 60W Flash Lamp, 5 J, 9 µs, 60Hz
6282 Mercury 200 to 2500 nm 50 Watt Mercury Lamp
6283NS Mercury 200 to 2500 nm 200 Watt Mercury Lamp
6286 Mercury 200 to 2500 nm 350 Watt Mercury Lamp
6285 Mercury 200 to 2500 nm 500 Watt Mercury Lamp
6287 Mercury 200 to 2500 nm 1000 Watt Mercury Lamp
6291 Mercury (Xenon) 200 to 2500 nm Hg(Xe) Arc Lamp, 200 W
6292 Mercury (Xenon) 200 to 2500 nm 200 Watt Hg(Xe) Lamp, Ozone Free
66142 Mercury (Xenon) 200 to 2500 nm 500 Watt Hg(Xe) Lamp
6293 Mercury (Xenon) 200 to 2500 nm 1000 Watt Hg(Xe) Lamp
6295NS Mercury (Xenon) 200 to 2500 nm 1000 Watt Hg(Xe) Lamp, Ozone Free
62712 Mercury (Xenon) 200 to 2500 nm 1600 Watt Hg(Xe), Ozone Free Arc Lamp
6297 EmArc™ Enhanced Metal Arc 200 to 2500 nm 200 Watt EmArc™ Enhanced Metal Arc
6332 Quartz Tungsten Halogen 240 to 2700 nm 50 Watt Quartz Tungsten Halogen, Short Filament
6337 Quartz Tungsten Halogen 240 to 2700 nm 50 W Quartz Tungsten Halogen Lamp
6333 Quartz Tungsten Halogen 240 to 2700 nm 100 Watt Quartz Tungsten Halogen
6334NS Quartz Tungsten Halogen 240 to 2700 nm 250 Watt Quartz Tungsten Halogen Lamp
6336 Quartz Tungsten Halogen 240 to 2700 nm 600 Watt Quartz Tungsten Halogen Lamp
6315 Quartz Tungsten Halogen 240 to 2700 nm 1000 W Quartz Tungsten Halogen
6317 Quartz Tungsten Halogen 240 to 2700 nm 1000 W, 28000 Lumens, 3200 K Color Temp.
6363 Infrared Elements 1 to 25 µm IR Emitter, 140 W Element
6575 Infrared Elements 1 to 25 µm Infrared Ceramic Element, 22 Watt
6580 Infrared Elements 1 to 25 µm Low Cost Infrared Element, 9 Watt
80030 Infrared Elements 1 to 25 µm 24 W SiC Source Element

Spectral Irradiance Data

Spectral irradiance curves for our lamps and solar simulators can be found below.

Deuterium Lamps Arc Lamps QTH Lamps Solar Simulators
LS-030a LS-031a LS-035a LS-174a