Laser Beam Profile Measurement

Given the different types of laser beam spatial distributions and their evolution as they propagate in free space and through optical elements, measurement of the beam profile is critical to quantify the irradiance at the point of the application. Monitoring the beam profile can also identify laser beam anomalies. This facilitates optimal alignment of a laser cavity or beam delivery optics resulting in significant improvements in laser processing (see Figure 1, for examples). Devices which measure and analyze the spatial distribution of a laser beam are called beam profilers and come in many different types, each with its own advantages and challenges. The basic types include array-based or camera-based profilers, mechanical scanning apertures, knife-edge scanners, and other devices. Since camera-based and scanning aperture profilers are the most common techniques, they are the subjects of this section. Camera-based systems are generally photodiode-based CCD (charge-coupled devices) or CMOS (complementary metal-oxide-semiconductor) devices. However, there are applications using arrays with thermal sensors for detection of longer wavelengths. Scanning aperture systems combine a moving slit and single-element photodetector to reproduce a beam profile by spatially sampling it.

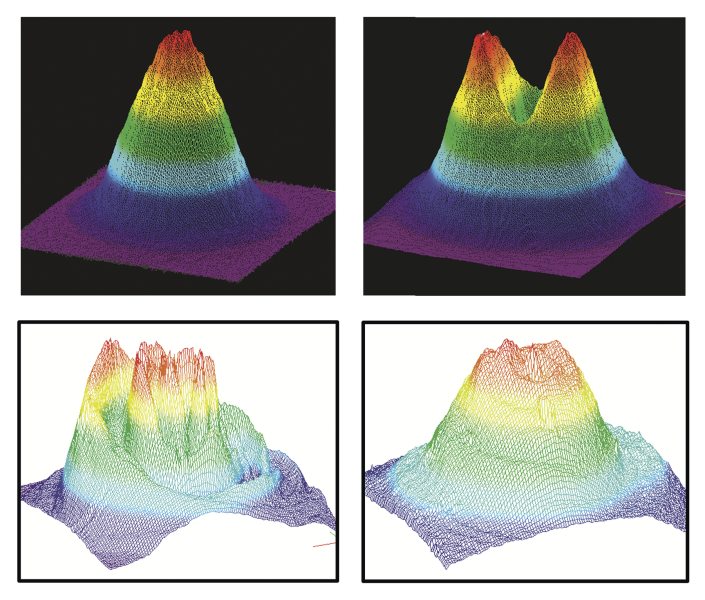
The laser and application dictate the criteria for selecting the best beam profiler Criteria include laser wavelength, beam size, power, pulsed or CW, and how the profiler will be used. The wavelength dictates the type of sensor to be used with Si providing sensitivity in the VIS and NIR, Ge and InGaAs covering the NIR, and pyroelectrics covering the UV and IR. A profiler must have a large enough aperture to accommodate the size of the beam while smaller beams will be limited by the resolution of the profiler, i.e., pixel size for a camera-based profiler and slit size for a scanning profiler. Since every profiler has a sensor, they are susceptible to saturation and optical damage, which limits the allowable incident laser power. The power can be attenuated or reduced prior to reaching the sensor to accommodate higher powers while scanning slit profilers may not require attenuation since they only sample a small portion of the beam’s power. Generally, scanning aperture profilers are only effective for pulsed systems above 1-2 kHz due to their mechanical nature while camera profiles can be used for either pulsed or CW sources. Camera profilers provide a true two-dimensional image of the beam and will show fine structure and hot spots, which a scanning slit may integrate out. Slit-based profilers will typically provide a more accurate beam size measurement and can measure very small beams directly.

Measured laser beams using a camera-based beam profiler
Figure 1. Measured laser beams using a camera-based beam profiler. Top row shows an industrial Nd:YAG laser exhibiting a Gaussian beam (left), which gives rise to a multi-peaked distribution following an increase in power of 1.7 times. Bottom row shows a CO2 laser profile before (left) and after cavity alignment (right).

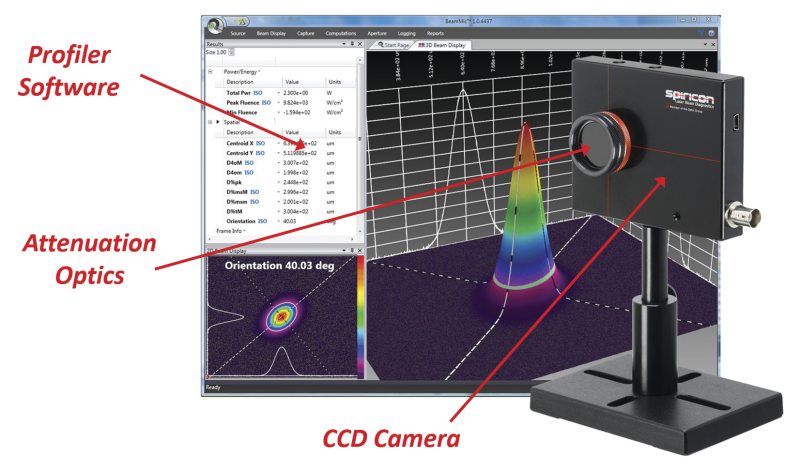
Camera-Based Profilers

Figure 2 shows a camera-based beam profiler system consisting of a camera, profiler software, and a beam attenuation accessory. An array detector contains many sensors arranged in a dense grid pattern and, since all the sensors can respond to incident light simultaneously, these detectors can transform an optical image into an electronic signal to be measured and analyzed. Camera-based profilers use array detectors and the major differences between them lie in the type of sensor used, the sizes of the individual sensor elements or pixels, and the signal handling and readout methods. The sensors are typically semiconductor photodiodes whose spectral sensitivity depends on the type of semiconductor material employed. However, thermal detectors such as pyroelectric sensors and bolometers (a thermometric device which changes its electrical resistance as a function of absorbed radiation) are also used if sensitivity in the IR is desired. The camera consists of an array of photosensors or pixels. The spatial resolution of the camera depends on the pixel pitch, i.e., pixel-to-pixel distance, and this varies depending on the type of sensor. For Si photodiode sensors, the pitch can be below 5 µm while Ge and InGaAs sensors have pitches in the 10’s µm range. Pyroelectric arrays have pitches that can reach slightly lower than 100 µm. The electronic signals from the pixels must then be read out. CCDs transfer the charge generated on each pixel to the adjacent pixel and so on until it reaches the edge of the array. The signals are therefore handled in a serial manner by the associated circuitry. By contrast, CMOS detectors read each pixel individually and therefore the signals are handled in parallel. This enables a much faster response for CMOS devices and, because they are based on widely used manufacturing technology, they are less expensive than CCDs. However, CCDs generally possess better linearity and noise characteristics.

Camera-based beam profiler system consisting of a CCD camera, profiler software, and beam attenuation optics
Figure 2. Camera-based beam profiler system consisting of a CCD camera, profiler software, and beam attenuation optics.
While the individual photodiodes that make up most cameras have very large dynamic ranges (see Photodiode Sensor Physics), this is reduced considerably for array detectors mainly due to the signal handling and readout. As a result, detector saturation occurs at much lower incident irradiances, and attenuation optics are often placed in the beam path prior to the detector. Beam profiling software, coupled to the camera, typically provides both image processing and data analysis capabilities. Image processing can include proper baselining, which helps eliminate background noise, electronic gain adjustment to maximize the dynamic range of the detector, and averaging, which can reduce noise. Data analysis should provide information on beam size, position, ellipticity (or deviation from a circularly symmetric beam), and real-time statistics of these values while also allowing for fitting of the beam profile to a Gaussian function. The benefit of a camera-based system is that the beam can be imaged directly and in real time to reveal not only the size and position of the beam but the distribution of the power/energy in the beam.

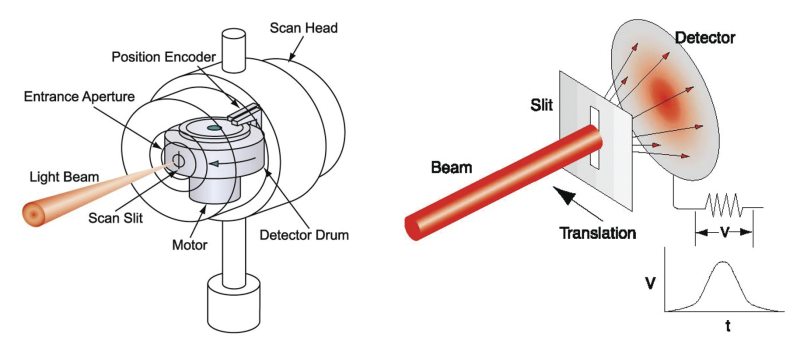
Scanning Slit Profilers

Figure 3 shows a scanning slit beam profiler in which a narrow slit moves through the beam and the light passing through the slit generates current in a single photodetector. Thus, as the slit scans through the beam, the detector signal is linearly proportional to the spatial beam irradiance profile integrated along the slit. A digital encoder provides accurate slit position. The photo-induced signal is digitized and analyzed to obtain the beam profile in the direction of translation of the slit. Typically, two orthogonal slits are sequentially moved through the beam providing profiles in these perpendicular directions. From these profiles, important spatial information such as beam width, beam position, beam quality, and other characteristics are determined.

A scanning profiler has several advantages over a camera profiler. Since only a single photodetector is employed, sensors with very different spectral sensitivities can be used, enabling profiling from UV to IR. A single detector also has a larger dynamic range compared to an array. Since the slit only allows a fraction of the beam to impinge on the detector, much higher powers can be measured without requiring additional attenuation. Because the slit plane is the measurement plane, it is also possible to measure the tightly focused beams with small spot sizes that cannot be directly measured with a camera. However, the scanning slit profiler only provides measurements along two orthogonal directions of a beam and therefore lacks the two-dimensional information available from a camera. Additionally, because the signal from the slit is integrated in one spatial dimension, the device is most appropriate for Gaussian-like laser beams. Due to the speed associated with the mechanical movement of the slit, the profiler can only measure CW and relatively high frequency pulsed beams. Beams with low pulse repetition rates, < 1 kHz, should be measured with a camera.

Scan head for scanning slit beam profiler and enlarged view of scanning slit that shows recording of beam profile
Figure 3. Scan head for scanning slit beam profiler (left) and enlarged view of scanning slit that shows recording of beam profile (right).

MKS Semiconductor Handbook Cover

For additional insights into photonics topics like this, download our free MKS Instruments Handbook: Principles & Applications in Photonics Technologies

Request a Handbook