Solar Simulator Curve Normalization

To simplify visual comparison of our solar simulators' curve shapes with the shapes of the standard solar spectra curves, we scale the measured simulator output, without changing the shape.

We use two types of normalization, one based on the total spectrum from 250 - 2500 nm, and the second based on 250 - 1100 nm. In each case, we calculate the normalization, or scaling factor, by comparing the total simulator irradiance with the total irradiance for the appropriate standard (ASTM or CIE) curve. Our comparison curves show the simulator multiplied by the scaling factor so the displayed simulator curve has the same total irradiance as the relevant standard curve over the spectral region of interest.

LS-177Aa
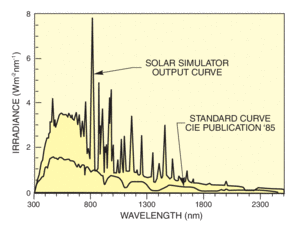
Figure 1: Actual (not normalized) measured output of the Model 91160 300 W Solar Simulator with AM 1 Direct filter, and a CIE standard spectrum for AM 1 Direct. The total output (250 - 2500 nm) for the simulator is 2550 W m-2 while that for the standard is 970 W m-2, i.e., the simulator is a 2.62 sun unit.
LS-177Ab
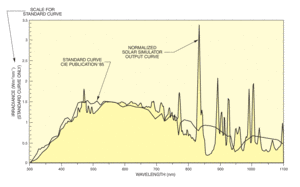
Figure 2: Output from the same simulator shown in Fig. 1, from 300 - 1100 nm, normalized to match the CIE standard curve. (There is negligible output from 250 - 300 nm.) The total output of the simulator from 250 - 1100 nm was 1810 W m-2, while that of the standard was 780 W m-2. The graph shows the simulator curve multiplied by 780/1810, and the standard curve.
LS-177Ba
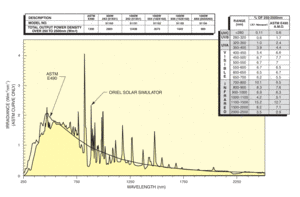
Figure 3: Typical output spectral distribution of Oriel AM 0 Simulators normalized to the ASTM E490 standard spectrum by matching total power density from 250 - 2500 nm. The 1600 W Solar Simulators have ~30% higher irradiance than equivalent 1000 W Simulators.
LS-177Bb
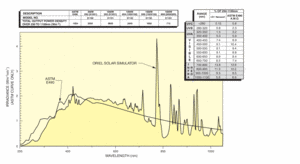
Figure 4: Typical output spectral distribution of Oriel AM 0 Simulators normalized to the ASTM E490 standard spectrum by matching total power density from 250 - 1100 nm. The 1600 W Solar Simulators have ~30% higher irradiance than equivalent 1000 W Simulators.
LS-177Ca
Figure 5: Typical output spectral distribution of Oriel® AM 1.5 Direct Simulators normalized to the ASTM E891 standard spectrum by matching total power density from 250 - 2500 nm. The 1600 W Solar Simulators have ~30% higher irradiance than equivalent 1000 W Simulators.
LS-177Cb
Figure 6: Typical output spectral distribution of Oriel® AM 1.5 Direct Simulators normalized to the ASTM E891 standard spectrum by matching total power density from 250 - 1100 nm. The 1600 W Solar Simulators have ~30% higher irradiance than equivalent 1000 W Simulators.
LS-177Da
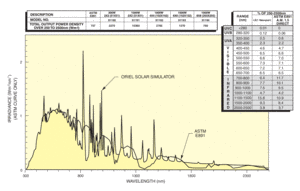
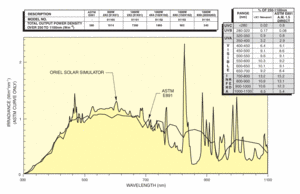
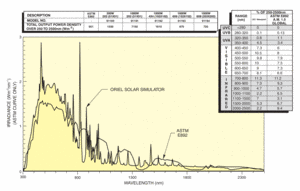
Figure 7: Typical output spectral distribution of Oriel® AM 1.5 Global Simulators normalized to the ASTM E892 standard spectrum by matching total power density from 250 - 2500 nm. The IEC 904-3 standard has the same shape as the ASTM E892. The 1600 W Solar Simulators have ~30% higher irradiance than equivalent 1000 W Simulators.
LS-177Db
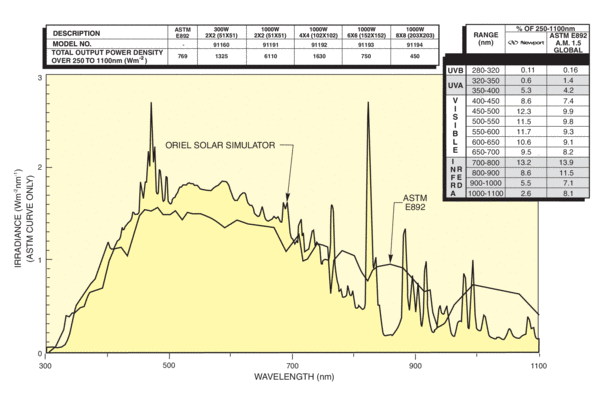
Figure 8: Typical output spectral distribution of Oriel® AM 1.5 Global Simulators normalized to the ASTM E892 standard spectrum by matching total power density from 250 - 1100 nm. The IEC 904-3 standard has the same shape as the ASTM E892. The 1600 W Solar Simulators have ~30% higher irradiance than equivalent 1000 W Simulators.