High Speed Detector Terminology

Several terms are used to describe the performance of high-speed detectors, and are defined as follows:

Conversion Gain, CG: The sensitivity of a detector or amplified detector (usually into 50 ohms) converted to Volts/Watt via Ohm’s Law. CG = Responsivity x 50 ohms.

Dark Current: The DC current that flows through a detector when there is no light present. Usually measured in the nanoamp range.

dB: Logarithmic unit of relative measure [e.g. 3 dB = ratio of 2:1].

dBm: Logarithmic unit of absolute measure for power [0 dBm = 1 mW].

NEP: The amount of optical input power that produces the same output level as the inherent noise level of the detector/receiver, i.e. a signal-to-noise ratio of one. Usually given in picowatts per root bandwidth. Total noise level is calculated by multiplying the NEP by the square root of the full bandwidth.

Optical Return Loss, ORL: The amount of light reflected (lost) back out of the detector towards the light source. Measured in dB relative to the input power level. For commercial single-mode systems, typical ORL values for a detector must be less than -27 dB. For multimode systems, -14 dB is usually the maximum tolerable value.

Power Bandwidth, -3 dB: The frequency at which the electrical output power of the detector falls to 50% of its value at DC. Same as “electrical” bandwidth. Typically used for specifying analog microwave detector bandwidths.

Pulse Width: The full duration at half the maximum value (FDHM) of the output current pulse when the detector is illuminated by a negligibly short optical pulse.

Responsivity, R: The sensitivity of a detector element to light given in amps/watt, independent of load resistance.

Rise Time: The 10–90% rise time of the output voltage step when the detector is illuminated by a negligibly short optical step function. This is difficult to do in practice, so the measurement is simulated mathematically by integrating the pulse width (see above).

Sensitivity: The optical input power (in dBm) required to achieve a particular Bit Error Rate, BER (or signal to noise ratio) at the output of the detector/receiver. Usually specified for BERs of 10-9 (or a S/N of 6). BERs of 10-12 require a S/N=7.

Voltage Bandwidth, -3 dB: The frequency at which the output current or voltage of the detector falls to 50% of its value at DC. Same as optical bandwidth. Same value as the -6dB power bandwidth.

Detector's temporal performance is often specified by either impulse response or rise time. Which one of these parameters is appropriate for your application?

Impulse response is best used when you are actually measuring pulses, i.e. signals that turn on and then return to zero. The impulse response of a detector tells you the shortest pulse you could ever expect to see output from the detector. For good resolution, you need to select a detector whose FDHM is at least three times shorter than the pulse you expect to measure.

Rise time is the parameter of choice when you are measuring either rising or falling edges. This type of measurement is especially common in digital communications systems where bit streams are comprised of an endless series of rising and falling edges. The rise time of a detector should be at least three times shorter than the rise time you expect to measure.

Clearly, impulse response and rise time are related quantities. Mathematically, the rise time of a detector can be obtained by integrating its pulse response. Clean pulses without tails or ringing approximate a Gaussian shape. Such pulses have rise times (10–90%) that are only 10% longer than the FDHM. In this case, the difference between the two values is negligible.

However, when pulse shapes deviate from the ideal, the difference between impulse response and rise time can indeed become significant. Pulses with positive tails produce longer rise times (and have less bandwidth), while pulses with negative ringing produce shorter rise times (and have enhanced bandwidth).

There are many common parameters one considers when selecting a detector for a particular application. These include pulsewidth, bandwidth, responsivity, spectral sensitivity, noise level, linearity, power handling, bias voltage, power consumption, to name a few. In optical communications, detector applications have evolved into two major groups that have significantly different requirements for the shape of either the temporal or frequency response. The particular response shape requirement is usually determined by whether the user has a time-domain, or a frequency-domain application. Keeping all this in mind, what does one actually look for when making a selection?

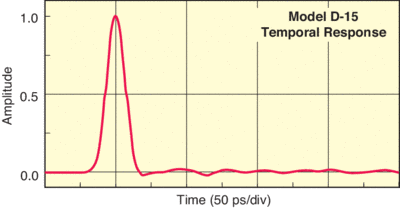
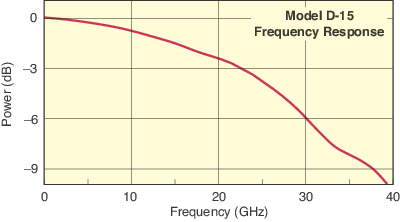
Figure 1a shows the 15 ps pulse response of a detector designed for time-domain applications. Figure 1b shows its corresponding frequency response curve. Note that in the time-domain the pulse is very “clean” showing very little tail or ringing. This type of Gaussian pulse response is ideal for applications where the temporal behavior of a waveform is under study, or where the temporal behavior of an optical signal must be converted to an electrical replica as accurately as possible. The most common applications are in signal diagnostics and receivers for digital communications, where temporal distortion can create bit-errors. Note that for this type of detector, the frequency response smoothly rolls off to a 3 dB point near 21 GHz that yields a Gaussian time-bandwidth product of 310 GHz-ps (power bandwidth).

Tutorial chart 1a-S
Figure 1a
Tutorial chart 1b-S
Figure 1b

Figure 1. Temporal response (a) and frequency response (b) of a time-domain photodetector (Newport D-15) having a nominal pulse-width of 15 ps (full duration at half maximum).

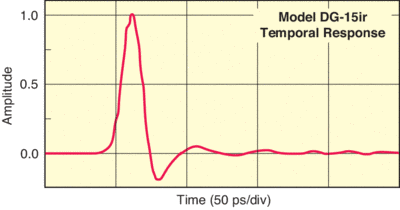
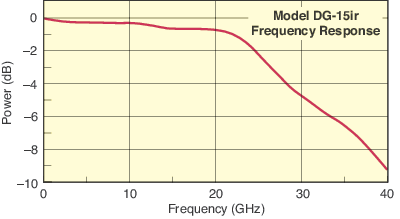
Figure 2b shows the frequency response of another detector designed for frequency-domain applications. Figure 2a shows its corresponding temporal waveform. Note that in this case, the frequency response has been designed to be flat within 1 dB from DC to 20GHz. Beyond this, the response decays rapidly. This type of detector is ideal for many analog, microwave applications where a narrowband signal can be detected anywhere within the operating bandwidth with essentially the same sensitivity as at DC. Common applications include microwave communication links and radar arrays.

Tutorial chart 2a-S
Figure 2a
Tutorial chart 2b-S
Figure 2b

Figure 2. Temporal response (a) and frequency response (b) of a frequency-domain photodetector (Newport DG-15ir) having a nominal pulse width of 16.5 ps (full duration at half maximum).

Note that the squared-off shape of the frequency response in Figure 2b results in significant ringing in its corresponding time-domain response. As a result, this type of detector would be a bad choice for time-domain applications. Similarly, frequency-domain users would be disappointed with a time-domain detector whose responsivity naturally drops by 3 dB at high frequencies, as shown in Figure 2b.

The nominal pulse width for these detectors might be specified as 15 ps for both products. However, it is the shape of either the temporal response or the frequency response that determines its usefulness for a particular application. Note that the pulse width is really only an accurate measure of comparison for time-domain detectors when there are no artifacts on the waveform and the pulse shapes are the same.

There are many terms used to describe the bandwidth of a photodetector, but the two most common, “optical bandwidth” and “electrical bandwidth”, also tend to be misleading - leading to some confusion when making detector comparisons. Let’s attempt to clarify the nomenclature by describing a technique for measuring bandwidth.

A photodetector is a converter of optical power (mW) to electrical current (mA). This is why responsivity is specified in amps/Watt. High-speed detectors are simply designed to perform the optical to electrical conversion extremely quickly so when a short pulse of light arrives, the detector produces an exact replica of the input as a current pulse at the output. The shortest current pulse that can be produced at the output determines the speed of the detector.

The speed of a short-pulse detector can be determined by applying an extremely short optical pulse to the input, and then measuring the duration of the current pulse produced at the output. The output pulse is directed through a load resistor (usually 50 Ω) in order to generate a voltage pulse that can be displayed and measured on an oscilloscope. It is here that the pulse duration is determined.

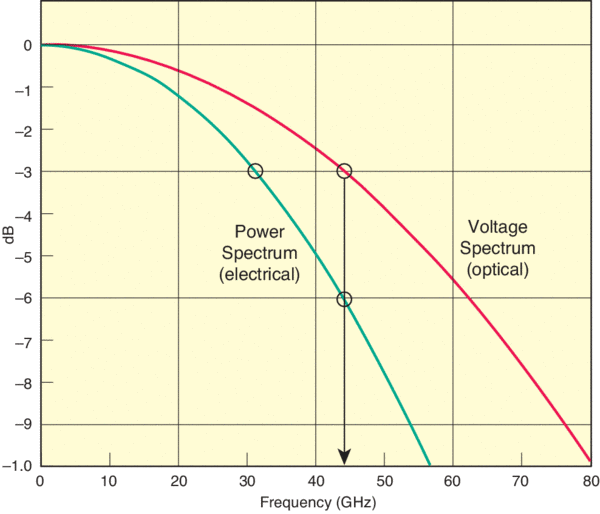
The frequency response can be determined from the voltage pulse by mathematically transforming it to yield a voltage spectrum that shows how the response rolls off at higher frequencies (see Figure 3). The bandwidth of the detector is then defined as the frequency at which the response drops to 50% of its value at DC. On a log scale, this is the -3 dB point of the voltage spectrum, and it is referred to as the voltage bandwidth. It is this same measure of bandwidth that is referred to as optical bandwidth by other manufacturers.

Frequency response of an ideal 10 ps detector
Figure 3. Frequency response of an ideal 10 ps detector.

“Voltage” Bandwidth = “Optical” Bandwidth

In analog, microwave applications the frequency response of a photodetector is often measured by using a microwave power meter, which gives a reading proportional to the square of the output voltage and therefore results in a power spectrum (see Figure 3). In this case, the bandwidth is defined as the point where the output power drops by 50% relative to its DC value. Once again, on a log scale, this is the -3 dB point of the power spectrum, and it is referred to as the power bandwidth. Historically, this has also been called the electrical bandwidth, in spite of the confusing fact that both voltage and power are electrical terms.

“Power” Bandwidth = “Electrical” Bandwidth

Newport’s high-speed detectors are specified by both voltage and power bandwidth to avoid any confusion. The relationship between voltage and power spectra can be seen in Figure 3. The power spectrum simply goes as the square of the voltage spectrum, because power is proportional to the square of the voltage. On the log scale, this squared relationship appears as a factor of two difference in decibels (dB). Therefore, you see that when the voltage spectrum has dropped to its -3 dB point, the corresponding power spectrum has dropped to its -6 dB point at exactly the same frequency.

Mathematically:

-3 dB voltage bandwidth = -6 dB power bandwidth

As a result, when comparing detectors, be sure you are comparing apples to apples, or in the case of detectors, the same measures of bandwidth. For most detectors, the voltage bandwidth is always greater than the power bandwidth, although the exact relationship is highly dependent on the shape of the individual detector's response curves.

In general:

-3 dB voltage bandwidth > -3 dB power bandwidth