Understanding Total Measurement Uncertainty in Power Meters and Detectors
It is important that users of calibrated power meters and detectors understand and take into consideration the total uncer- tainty or error that exists in their measurements. Often, users assume that the rated calibration uncertainty of the Newport detector or power meter is the only error in their measurements, however, other factors also contribute to measurement uncertainty. Total measurement error is the sum of all possible sources of error, with detector or meter uncertainty being one of multiple sources of error in the measurement.
While it is always a challenge to know exactly how much error the measurement system has, there are certain identifiable factors that should be taken into consideration when estimating total measurement uncertainty in detectors or power meters. These include (where applicable):
- Detector Calibration Uncertainty
- Sensor Uniformity
- Active Area of the Sensor
- Angular Dependence
- Linearity
- Temperature
- Meter Accuracy
- Meter Range
This discussion will review the different contributors to measurement error and how they may be incorporated into an estimate of the total measurement uncertainty.
Detector Calibration Uncertainty
Newport’s production detector calibration uncertainty is determined from calibration data correlated against a NIST (National Institute of Standards and Technology )-traceable Working Standard and the statistical figure of merit known as Gauge Repeatability and Reproducibility (GR&R) as applied to Newport’s calibration system.
Newport’s Working Standard Detectors
Newport’s Working Standard Detectors are calibrated against a NIST-Calibrated Reference Detector (the “golden stan- dard” detector) periodically. NIST-Calibrated Reference Detectors are calibrated for Newport by the NIST and have tabulated uncertainty vs. wavelength. Newport’s Working Standard Detectors are used for calibrating new production units and for re-calibrating customer’s detectors. A report is provided with each new production or re-calibrated detector that contains a record of the measurement of spectral responsivity in amperes/watt (A/W) of incident radiation in 10 nm increments over the entire spectral range of the detector.
Calibration Procedure
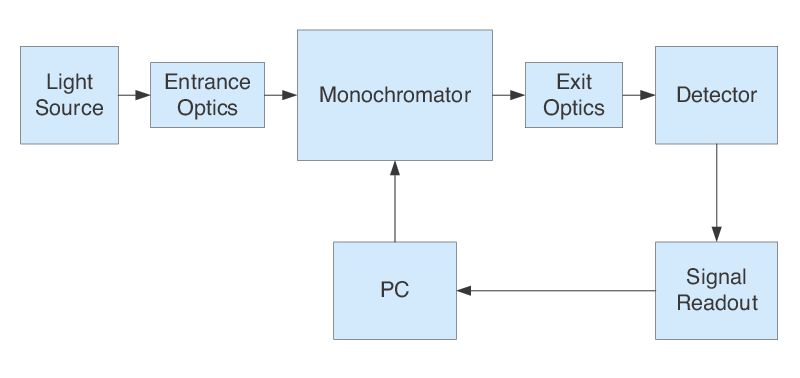
Calibrations are performed in a stringently controlled environment using a broadband light source, a tunable monochro- mator, a working standard detector, a power meter and the detector undergoing calibration (Figure 1). When in use, the detector is positioned to ensure that the beam hits the center of the detector element with a pre-defined spot size. The monochromator-based calibration system typically measures only one power level during calibration, even though the level can vary slightly over time as the lamp in the light source ages.
In the initial step of the calibration procedure, the appropriate Working Standard Detector is placed in the detector position of the calibration system shown in Figure 1. Using an automated program, the optical power of the broadband light source is measured with this detector at 10 nm increments. This calibrates the optical power output of the system to the accuracy of the NIST Calibrated Reference Detector plus any error introduced in transferring the NIST calibration to the Working Standard Detector. Following calibration of the system with the Working Standard Detector, the production or customer detector (the Detector Under Test or DUT) is put into the system and the same procedure followed as was used for the Working Standard Detector measurement, with the exception that the data collected from the DUT is the current (Amps) output by the device. Since the Working Standard Detector calibrated the system’s optical power at 10 nm intervals, this data can be used to determine the DUT’s responsivity as detector current vs. optical power (A/W).
Gauge Repeatability and Reproducibility
Gauge Repeatability and Reproducibility is a statistical method that distinguishes the variation in a measurement arising from the detector (repeatability) vs. the external calibration conditions (reproducibility). Repeat- ability measures the variability in detector measurement of the same parameter under the same conditions over repeated measurements by the same operator. As such, it measures the inherent variability of the detector. Reproducibility measures the variability in a detector measurement that is due to the variations in the errors introduced by different conditions such ambient conditions and operators. High GR&R numbers indicate instability in a measurement system while lower numbers indicate low measurement uncertainty. Newport’s calibration facilities maintain the highest standards in their calibration systems, guaranteeing low GR&R numbers.
Specified Calibration Uncertainty
Using NIST’s and Newport’s standard uncertainties and standard deviations from calibration measurements and the GR&R numbers calculations based on the calibration system and process, Newport specifies the calibration uncertainty of its detectors with a 95% confidence level. Calibration information, including responsivity data, calibration date, model number, and serial number, is saved in an EEPROM which is supplied with the detector. When a detector is calibrated at Newport facilities, it does not include errors arising from factors outside of the detector calibration uncertainty. These include:
- Sensor Response Uniformity
- Active Area of the Sensor
- Angular Dependence of the Sensor
- Variations in Linearity
- Temperature Sensitivity
- Power Meter Accuracy
- Power Meter Range
When accuracy specifications are given with a sensor they assume typical working conditions and include temperature, power meter uncertainty factors. Linearity, angular dependence and beam positioning errors need to be added separately.
Calculation of the total error in detector measurements must include consideration of these factors. They are described in more detail in the following sections.
Sensor Response Uniformity
Detector calibration systems require a fixture to precisely and repeatably position new production detectors and customer units so that the light beam is always positioned at the exact center of the detector. The reason for this lies in the fact that the light sensing element in the detector exhibits a spatially non-uniform electrical response to light over its surface, by as much as ±2%. This nonuniformity is a consequence of unavoidable and small local variations that occur in all sensor fabrication processes; there is always some spatial nonuniformity of response in all kinds of detector, including photodiode, thermopile, and pyroelectric. The nature of the nonuniformity is different, depending on the materials and the processing techniques used to fabricate the sensor. Nonuniformity in a sensor is defined as the variation in responsivity (A/W) to a small diameter (~1 mm) laser beam over the surface of the sensor’s active area. Since the granularity of the variations over a sensor surface can be quite small, of the order of microns rather than millimeters, measurement nonuniformity is inversely proportional to the spot size of the laser beam used to make the measurement. Newport specifies the nonuniformity of the sensor in its optical detector products. Not all photodiode manufacturers publish a specification for sensor response uniformity.
Active Area of the Sensor
Nonuniformity of the sensor response is impacted by the fact that the active area of the sensor may not be precisely defined, owing to wirebonding and other design features that exist on the sensor periphery. As well, the responsivity of the detector falls sharply near the edge of the photosensitive area. and some amount of current may be generated even when photons land outside of the designated active area of the sensor. Therefore, if the spot size of the input beam is close to the active diameter of the photodiode, users should always employ a detector aperture diameter that is smaller than the specified active diameter of the sensor.
Angular Dependence of the Sensor
The responsivity of the sensor in a detector exhibits an angular dependence. This is due to the presence of protective coatings on the surface of the sensor, especially photodiodes. The latter type of sensor is typically coated with a protective clear epoxy and an anti-reflective coating. The stacked thin films of these materials exhibit a strong angular dependence for the amount of light that is reflected from the surface and from the interface between the films. During calibration, the sensor housing is precisely positioned so that the light beam coming from the monochromator impinges on the sensor surface at a 90° to that surface (Figure 1). (Note that photodiodes are normally positioned at a slight angle to the front face side of the detector housing, to avoid back reflection of the beam into the laser cavity. This configuration results in minimum reflection of the incoming light from the surface and interface between the protective and anti-reflective films. As the angle of the incoming light beam departs from 90°, more and more light is reflected from the surface and interface, reducing the measured power of the optical signal.
Many detectors with photodiode sensors employ a neutral density (ND) filter to attenuate the incoming light beam and avoid saturation of the photodiode sensor. ND filters exhibit issues with angular dependence of the degree of light reflected from the surface of the filter material as are seen with the coatings on sensors. For these reasons, the user must always take care to position the sensor surface at an angle as close as possible to normal to the incoming light beam.
Variations in Linearity
Optical sensors have a defined range in which the electrical output (amps or volts) responds linearly to the optical power input (watts). Beyond this range, the response becomes increasingly nonlinear as the sensor approaches saturation. The user must carefully select the detector type for a given application in order to ensure that the detector will not saturate within the range of power levels expected for the measurement. As well, the user must be aware of the fact that, even within the linear range, every detector exhibits a characteristic error in its responsivity. The calibration procedure measures the responsivity at only one current level at each tested wavelength. Typically, each detector type will have specifications for the error in the linear range that the user must take into account when calculating total error.
Temperature Sensitivity
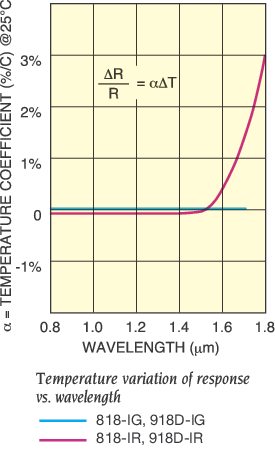
Temperature affects measurement accuracy for all types of optical sensors. Photodiode sensors exhibit a wavelength- dependent change in optical responsivity with temperature. Figure 2 shows the variation of the temperature coefficient of sensitivity for different semiconductor materials used in optical sensors. The chart illustrates how this change varies with the wavelength of the laser light impinging on an optical sensor fabricated with the different semiconducting materials. These materials exhibit different maximum wavelengths below which the optical responsivity does not change with changes in temperature. As the laser wavelength approaches and passes through this maximum, the output of the sensor becomes increasingly sensitive to the temperature of the photodiode sensor due to the inherent bandgap structure.
Most of the Newport’s 918D series detectors employ an internal temperature sensor. Advanced power meter models such as 841-PE-USB, 1919-R, and 1936-R/2936-R can read the temperature and compensate for the responsivity differences that arise from the difference between the temperature during calibration and at measurement by the user. These optical power meters are equipped with a proprietary responsivity calculation algorithm.
If a detector without a temperature sensor is used with lasers operating at wavelengths beyond the wavelength maximum, they MUST be used only under constant temperature conditions. Any comparisons of data from different photodiode sensors used for measurements of similar lasers operating beyond the wavelength maximum are only valid if the data is collected at exactly equal temperatures. Otherwise, photodiode sensors should not be employed with lasers operating at wavelengths near or beyond the semiconductor material maximum.
Thermal optical sensor measurements can be affected by variations in ambient temperature. In thermal sensors, the heat flow between the center of a thermal disk, where the laser beam impinges, and the cooler periphery of the disk generates a voltage proportional to the optical power of the laser beam being measured. A thermal sensor’s output is independent of ambient temperature, provided that the sensor is in equilibrium with its surroundings. However, if the temperature of the sensor differs from ambient, that difference will manifest as an offset on the meter readings. For example, a thermal sensor moved from a hot car into an air-conditioned office will indicate a negative offset on any measured reading until the sensor is at the same temperature as the ambient environment. Similarly, radiating high temperature sources (e.g. the laser system) will be detected by the sensor, producing a positive offset in measured readings. In general, a user should measure the power on the sensor before applying the laser beam to make sure no additional sources are influencing the power.
Power Meter Accuracy
A power meter is essentially a highly sensitive ammeter or voltmeter and different power meters have different characteristic accuracy specifications. The optical sensor in a detector generates either a current or a voltage output signal and the inherent error in the power meter that reads this signal must be considered for total error calculations.
Power Meter Range
The power meter accuracy specification is only valid so long as the measurement is performed within the correct power range. Each power meter has several ranges within which the amplified signal is properly matched to the meter circuitry. Once the optimal range has been determined, it is normally recommended that the user stay in that range to obtain the most reliable data. The “Auto” range setting on a power meter is a convenient feature that can ensure that the meter is set to the proper range for the power measurement no matter what the laser power level is. Since it normally takes a finite amount of time for a range change, care should be taken that measurements are not made in the transient period to avoid inaccurate or invalid measurements.
Calculation of the Total Error
When dealing with simultaneous sources of error in a measurement, the RMS noise is calculated as the square root of the sum of the squared errors. For example, consider a measurement that is carried out under conditions that are very close to the maximum power rating of the detector with the physical set-up such that the measurement is made slightly off-center on the sensor (but still within 50%). In this case, the total error is a combination of all the known error sources. For example:
- ±2% due to the basic calibration uncertainty in the detector (95% confidence level),
- ±1% additional error due to the nonlinearity of measurements at high power,
- ±2% additional error due to the laser beam not being centered on the sensor.
- Any other known sources or errors
The total error in this case is calculated as at least ±3%:
Total Error = ±√(22+12+22) = ±√9 = ±3%
It is noteworthy that, even in a case with multiple sources of error, the total error is often not a great deal more than the basic calibration uncertainty. There can be other unknown or unaccounted sources of error, but in most cases their contributions are insignificant. However, once a previously unaccounted error source, such as a fluctuation of the input laser beam, proves to be significant, its contribution to the total amount of error must be estimated and added in the calculation.
Conclusion
The total uncertainty of a measurement must always be considered when using calibrated power meters and detectors in optical measurement systems. Calculations of the total uncertainty of a measurement are not limited to just the inherent calibration error of the detector; total uncertainty must include estimates for all other known sources of error in the measurement system. Detector calibration errors do not include sources of error in the measurement system such as the temperature, active area and angular dependence of the sensor responsivity, nonuniformity of responsivity over the sensor area, variations in linearity of the sensor response at high optical power, and the range and accuracy of power meters. Calculation of the total error in optical measurements must consider all these factors plus any other known sources of error in the system.
Uncertainty of calibration may be periodically updated and it is necessary take any changes into account when calculating total uncertainty. The values of calibration uncertainty can be found at the top of the certificate of calibration and are given for thermal and photodiode sensors below:
- Thermal Sensors
- 1.9%
- UV-VIS Photodiode Sensors
- 3.4% (220 to 300 nm)
- 1.65% (300 to 430 nm)
- 1.1% (430 to 100 nm)
- 4.3% (1035 to 1065 nm
- IR Photodiode Sensors
- 2.4% (700 to 1430 nm)
- 2.6% (1430 to 1600 mn)
- RM Photodiode Sensors
- 4,5% (250 to 300 nm)
- 3.4% (400 to 850 nm)