A Survey of Methods Using Balanced Photodetection

New Focus balanced photoreceivers are ideal for optical detection applications that require sensitive measurements. This application note focuses on several techniques, divided into three categories: small signal detection in time domain, small signal detection in frequency domain, and coherent heterodyne detection.

FM Spectroscopy with tunable diode lasers takes advantage of the change in optical absorption as a function of the frequency (wavelength) of light passed through the sample.

Balanced photodetection is a commonly used detection method in the lab when an experiment requires increased signal-to-noise. This detection method has many advantages to simply amplifying a signal, either with an amplifier following the photodiode, or with an avalanche photodiode (APD) for example. It is particularly powerful in its ability to cancel laser noise or “common mode noise” and in its ability to detect small signal fluctuations on a large DC signal. In this application note we explore a wide variety of detection methods utilizing balanced photodetectors and briefly discuss their implementation.

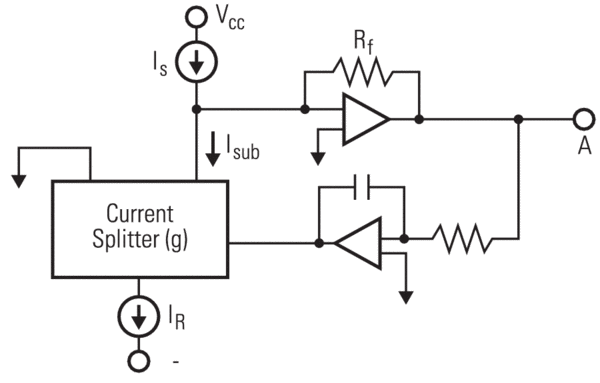
The most simple case of balanced detection is realized when two photodiodes are connected such that their photocurrents cancel. In this case, it is necessary to equalize the DC optical power impinging upon each photodiode by using a variable neutral density filter, for example. When this is done, the effective output of the balanced pair of photodiodes is zero until there is some difference in the intensity of one of the beams. When this occurs, it causes the pair to become “unbalanced” and a net signal appears on the output. To avoid the often tedious, manual task of balancing the intensities of the two beams, an auto-balancing circuit can be employed which was originally developed by Hobbs at IBM1-3. The circuit uses a low-frequency feedback loop to maintain automatic DC balance between the signal and reference arms. As shown in Figure 1, it consists of two photodiodes (one each for the signal and reference beams), a current splitter, a current subtraction node, a transresistance amplifier, and a feedback amplifier. This balanced optical receiver allows detection of a small signal upon a large background. Again, the receiver works by subtracting the photocurrents from two well-matched photodetectors.

Common-mode noise that is present on both the reference and signal beams (such as laser intensity noise) is cancelled out and therefore does not appear as part of the signal. On the other hand, any imbalance between the photocurrents generated by the reference and signal detectors is amplified and is seen as the received signal. New Focus provides five types of balanced photoreceivers. The patented Nirvana™ auto-balanced photoreceivers (Model. 2007 an. 2017 ) enable reduction of common-mode laser noise by more than 50 dB at frequencies from DC to 125 kHz in either simple balanced mode, or by utilizing the auto-balancing circuit. The high-speed balanced detectors (Models 16x7 and 18x7) enable balanced detection at 80 to 800 MHz bandwidths. Three low-frequency photocurrent outputs and one high-frequency RF output are provided for monitor purposes. The 10 MHz (Models 21x7) and large-area (Models 23x7) balanced receivers offer high gain and are suitable for coherent heterodyne detection applications. All three types of balanced receivers have matched, amplified photodiodes.

Schematic of the feedback loop in the New Focus™ Nirvana™ auto-balanced photoreceiver
Figure 1. The feedback loop in the New Focus™ Nirvana™ auto-balanced photoreceiver splits the reference photodetector current, IR, to generate the cancellation photocurrent, Isub. The laser amplitude noise is cancelled when the DC value of Isub equals the signal current, IS, from the signal photodetector.

I. Signal Detection in the Time Domain

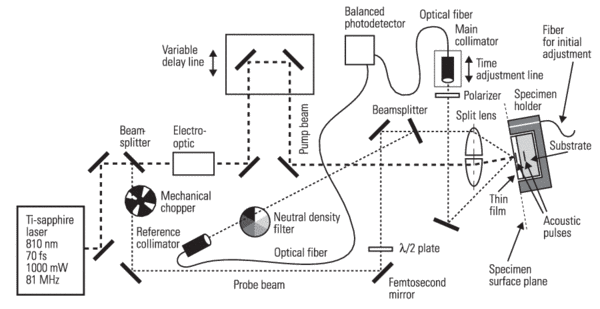
Owing to the advent of femtosecond Ti:sapphire pulsed lasers (with pulses as short as only a few optical cycles), the ultrafast pump-probe method has been successfully adapted to detect small, time-domain signals in many areas. New Focus balanced photoreceivers are particularly well suited to optical, time-resolved pump-probe measurements as in Figure 2.

Femtosecond Ultrasonics

One example associated with the balanced photodetection technique is femtosecond ultrasonics wherein a femtosecond laser pulse is used to excite an acoustic wave in a material. The length of mechanical (acoustic) wave determines the resolution of ultrasound. Depending upon the materials for test, the velocity of sound, propagating through the media, has a magnitude in the order of 103 m/s. The acoustic wavelength employed in classical ultrasonics locates at around 0.1–10 mm, depending on materials and frequencies. A growing demand of computer chip manufacturers for non-destructive testing of microstructures and thin films has pushed the wavelength scope down to 10–20 nm.

Piezoelectric devices used for production and echo detection of acoustic waves in the macroscopic scale are too rigid in order to resolve signals within time scales of a few picoseconds and corresponding frequencies of 0.30.6 THz. In 1987, researchers at Brown University4 proposed the use of laser-generated ultrasound for film thickness measurements. The performance of the laser-based acoustic method has been further improved recently by means of double-frequency modulation, cross-polarization, and balanced photodetection techniques5. Shown in Figure 2 is an improved pump-probe laser-based ultrasonic set-up as it is realized at the Center of Mechanics, Swiss Federal Institute of Technology in Zürich. The specimens (DUTs) consist of aluminum film (with 100, 200, or 300 nm in thickness) on a sapphire substrate.

A Ti:sapphire laser is used in this event to create short laser pulses having durations of less than 70 fs (1015 s) and a wavelength of 810 nm at a repetition rate of 81 MHz. The laser beam is split into a pump beam (carrying 90% of the energy) and a weaker probe beam by a beamsplitter. The short pump pulse hits perpendicular to the surface of the film specimen, and is absorbed within a thin surface layer (less than 10 nm deep). A mechanical stress is generated, which then excites thermo-elastically an acoustic pulse. When the bulk wave propagates and hits a discontinuity of the acoustic impedance (note: the film substrate border represents a strong discontinuity of the acoustic impedance), an echo occurs which is heading back to the surface of the film. Reaching the surface, the echo causes a slight change of the optical reflectivity.

The purpose of the probe pulse is to scan the optical reflectivity at the thin film surface versus time. Therefore, the experiments are constantly repeated at a repetition rate of 81 MHz, while the length of the optical path of the pump beam is varied. This means that the relative time shift between the pump pulse and the probe pulse is varied, and the optical reflectivity at the surface is scanned versus this relative time shift.

The change of the optical reflectivity caused by the acoustic echoes is very small, and typically well below the noise level. Improvements need to be added, in order to reduce optical and electric crosstalk between the excitation and the detection, as well as to separate the signal of interest from surrounding noises. Thus, the goal of the set-up is to isolate the thermal-acoustic phenomena occurring at the specimen as the only bridge carrying information from the excitational side (pump beam) to the measuring side (probe beam).

Various features are introduced to this set-up. Double-frequency modulation: The pump beam and the probe beam are modulated at different frequencies. The pump beam is modulated harmonically at a frequency of 19 MHz, and the probe beam is chopped mechanically at a frequency of 300 Hz. A dual lock-in amplification scheme is applied in order to extract the signal caused by the acoustic echoes. Cross-polarization: The pump pulses and the probe pulses propagate in different polarization planes. Therefore, a plate is shifted into the probe beam; in order to turn the original vertically polarized light into a horizontal plane. Balanced photodetection: A balanced photodetector (such as New Focus™ Model 1607) is receiving light from the two probe beams (i.e., one signal reflects at the specimen and one reference beam reflects at a beamsplitter before it hits the specimen) through two single-mode fibers. The intensities and the phase shift of these two probe pulses are carefully equalized before the difference of its intensities is measured and amplified by the balanced photodetector.

These added features show two major advantages: first, the detected signal is caused by the optical reflectivity change only, and, secondly, fluctuations of the intensity are cancelled out by the balanced photoreceiver, thus, reduce the noise level in general. The sensitivity improvement of this set-up is estimated to amount to one to two orders of magnitude. Applications need non-destructive, in-situ metrology, such as small-scale material characterization, MEMS inspection, etc., will see benefits from this femtosecond ultra-sonic method.

Diagram of the optical components of improved laser-based acoustic set-up for thin film and microstructure metrology
Figure 2. The optical components of improved laser-based acoustic set-up for thin film and microstructure metrology.5 Note that the signal processing (after the optical reflectivity of the specimen surface is detected by the balanced photoreceiver) of the set-up is not shown here.

Frequency Modulation Spectroscopy

In order to interrogate the spectral absorption profile of a sample (such as a noble gas), frequency modulation spectroscopy takes advantage of the change in optical absorption as a function of the frequency (wavelength) of light passed through the sample. A tunable laser can be used to generate a beam whose wavelength is time-varying. This beam is then split into two beams for balanced detection, one passing through the sample, and the other going directly into the reference photodiode. This differential measurement is the basis of FM spectroscopy. Since the time axis of the observed signal is directly related to the optical frequency, the observed signal can easily be couched in terms of optical frequency (hence the name frequency modulation spectroscopy). By using a balanced photoreceiver, any fluctuations of the laser's intensity can be directly eliminated. In addition, the small percentage fluctuations on the DC optical signal due to the time-varying absorption of the sample can be detected with greatly enhanced signal-to-noise by employing a balanced photoreceiver. Light scattering spectroscopy (LSS) detects the scattered electric field interferometrically. It is very sensitive to phase front variations in the scattered wave.

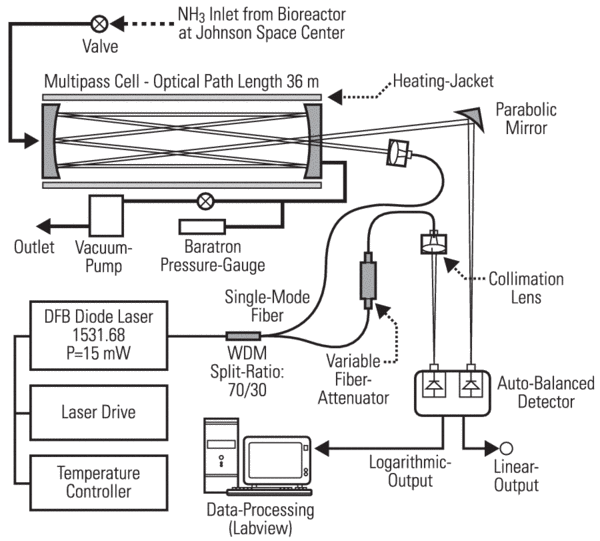
Diagram of diode-laser-based trace gas sensor configuration for continuous NH3 concentration measurements
Figure 3. Diode-laser-based trace gas sensor configuration for continuous NH3 concentration measurements at 1.53 µm.6.

II. Small Signal Detection in the Frequency Domain

Laser-based spectroscopic techniques have been developed as one of powerful means to detect trace gases, molecular ions, etc. With adding balanced photodetection function, the sensitivity of absorption spectroscopy will be greatly enhanced.

Infrared Gas Sensors

Fellows in Rice University6 developed a portable diode-laser-based gas sensor for on-line NH3 monitoring in a bioreactor system (as a part of water recovery system being developed at the NASA Johnson Space Center), as shown in Figure 3. Ammonia has a rich spectrum in the near-IR region. One of the lines at 1531.7 nm was chosen as the operating wavelength for the NH3 sensor described here, due to it has less interference and was determined to be one of the best lines (from 1450 to 1560 nm) for monitoring purposes7. The principal optical gas sensor technologies are based on absorption spectroscopy of fundamental bands in the 3-25 µm spectral region, and near-IR vibrational overtone and combination bands from 1-3 µm. Overtone spectroscopy exhibits absorption line strengths that are typically approximately 1-2 orders of magnitude weaker than those of the fundamental vibrations in the mid-IR. To obtain the required sensitivity in the near-IR, longer absorption path lengths and optimal balancing of laser noise are required. For this purpose, a compact multipass cell, configured for a 36 m total optical path-length, and a dual-beam, auto-balanced InGaAs detector (New Focus™ Nirvana™ auto-balanced photoreceiver Model 2017) were used. As shown in Figure 3, a two-stage diaphragm pump was used to flow the sample gas through the multipass cell at a pressure of 100 Torr. A DFB laser diode delivers 15 mW at 1531.7 nm with a specified linewidth of less than 10 MHz. The fiber was fusion-spliced to a 70/30 beamsplitter. The 70% power arm of the coupler was sent to the multipass cell by use of a lens. The 30% power arm was used as the reference beam for the balancing detector. The output power obtained from the cell after 182 passes was 17 µW. Because the reference beam power was much greater than the power of the signal beam coming from the cell, it was attenuated with a variable fiber attenuator. For optimum performance of the auto-balanced detector, the reference power was set as Pref=2.2xPsignal at the center frequency of the laser scan. A laptop PC was used for data acquisition and processing. In the auto-balanced mode, 500 scans were averaged for each single concentration measurement. For the concentration measurements made with the detector in the linear mode, 1000 scans were used for a single measurement, because of the lower signal-to-noise ratio (SNR) of this mode. The total data collection time, averaging, and processing to obtain a single concentration measurement is less than 30 s. This diode-laser-based ammonia sensor can be used in other applications, especially those with concentration levels of 1 ppm and higher, that need to be monitored with a fast time response.

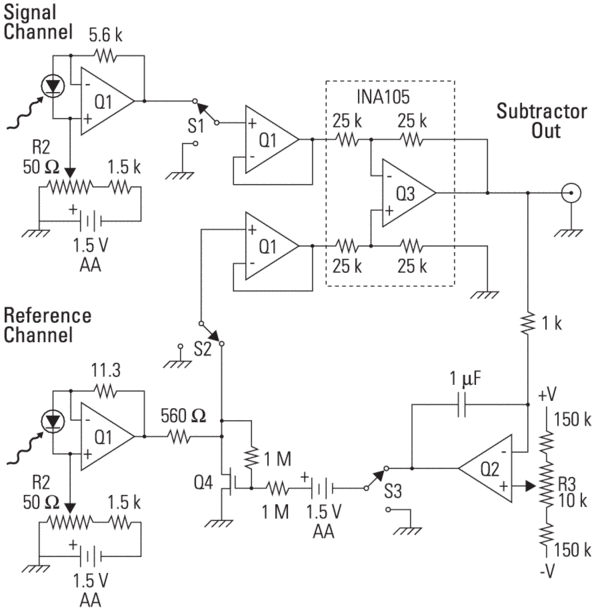
Circuit diagram for the auto-balancing transimpedance differential amplifier
Figure 4. Circuit diagram for the auto-balancing transimpedance differential amplifier proposed by the University of Chicago8. The following components were used in the design: Q1-OP470 very low noise quad op-amp, Q2-LF356 op-amp, Q3-INA105 precision unity gain differential amplifier, and Q4-2N5457 MOSFET. Optical coherence tomography (OCT), a promising new class of diagnostic medical imaging techniques, measures the time delay and magnitude of optical echoes at different transverse positions.

H3+ Infrared Spectrum

Since 1980, the infrared spectrum of H3+ has been an important probe in many fields, including interstellar chemistry, the study of planetary ionospheres, and theoretical calculation of rovibrational energy levels of polyatomic molecules. In order to provide transition frequencies of H3+ to theorists and astronomers, 17 laboratory spectroscopic studies have been performed over the past two decades, resulting in the observation of 895 different transitions. Most of the laboratory rovibrational spectrum of H3+ has been realized with a recently color center laser (CCL) spectrometer. With the spectrometer's significantly higher sensitivity and the plasma's higher vibrational and rotational temperatures, group at the University of Chicago8 was able to observe and assign 100 new transitions. In this experiment, H3+ was produced in a positive column discharge and detected using velocity modulation absorption spectroscopy9. In brief, an infrared radiation was produced by a tunable CCL with a wavelength between 2.3-3.5 µm and power greater than 1 mW. The light was split into two beams and passed four times in opposite directions through a plasma tube. After leaving the plasma tube, the two laser beams were detected with an auto-balanced detector as shown in Figure 4. Scientists in University of Chicago first attempted to apply Hobbs' circuit1-3 to their InSb liquid-nitrogen-cooled photodiodes, but, unsuccessful. They then create a new circuit as shown in Figure 4. Each photodiode is sent into a trans-impedance amplifier, where the photocurrents are converted to voltages, amplified, and given an offset controlled by R1 and R2. The purpose of this offset is to cancel out the background current associated with the unirradiated diode. The reference channel voltage goes through a feedback-controlled voltage divider before being subtracted from the signal voltage in Q3. A portion of the output is sent to an integrator, whose result controls the voltage divider. The integrator sets the divider in such a way as to reduce the DC in the subtracted output to zero, i.e., balanced operation. In conjunction with a 10 kHz velocity modulation, this circuit decreased the noise to within a factor of 20 of the shot noise limit at a 0.3 Hz bandwidth in this system.

Coherent heterodyne detection is widely used in Doppler LIDAR, optical communications, light scattering, and optical coherence tomography, etc., due to its advantages in high sensitivity and directionality. The fundamental limitation in SNR of this detection technique is the shot-noise associated with quantum fluctuations of the local oscillator (LO) laser. Using the balanced photoreceiver can solve the intensity noise issue.

Experimental set-up designed for field-based light scattering spectroscopic technique
Figure 5. Experimental set-up designed for field-based light scattering spectroscopic technique.

III. Coherent Heterodyne Detection

Experimental set-up of a simple OCT imaging system
Figure 6. A simple OCT imaging system12.

Light Scattering Spectroscopy

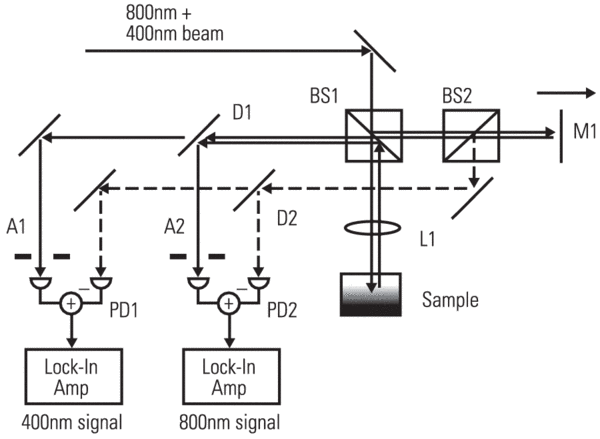
Light scattering spectroscopy (LSS) is a new technique capable of accurately measuring the features of nuclei and other cellular organelles in situ. This technique is of interest because changes in size of cell nuclei and their chromatin content (related to refractive index) are primary indicators of cancer. Until recently, the LSS information has been obtained from analysis of the intensity of white light backscattered from the tissues. Scientists in Massachusetts Institute of Technology demonstrated a field-based LSS technique10 recently. In contrast to its intensity-based counterpart, field based LSS, where the scattered electric field is detected interferometrically, is very sensitive to phase front variations in the scattered wave. Besides, it permits greater localization of smaller region for study. The set-up employs a Michelson interferometer with two low-coherence light sources. A Ti:sapphire laser operating in femtosecond mode (150 fs) produces 800 nm lights. A portion of this light is split off and up-converted to 400 nm by means of a 2nd harmonic generation crystal. The coherence lengths of both the primary and second harmonic are about 30 µm. The converted light is then recombined with the original beam.

As shown in Figure 5, the combined beam is divided by a beamsplitter (BS1) into probe and reference beams. The probe beam is focused onto the sample by means of a achromatic lens. The powers of the 400 and 800 nm components at the sample are 14 and 5.5 mW, respectively. The reference beam is reflected from a mirror (M1) moving at a constant speed, induced Doppler shifts of 14.6 and 7.3 kHz at 400 and 800 nm, respectively. It is then recombined with the probe light backscattered from the sample and transmitted to a dichroic mirror (D1), which separates the 400 and 800 nm components and delivers them to separate New Focus Model 2007 auto-balanced photoreceiver (PD1 and PD2). Apertures (A1 and A2) are placed in front of the detectors to limit the amount of collected light. A portion of the reference beam is separated by a second beamsplitter (BS2) and sent to a second dichroic mirror (D2). The two output components from this D2 mirror are delivered to the reference ports of the balanced photoreceivers. This serves to cancel power fluctuations at the two wavelengths. The heterodyne signal at each wavelength, which results from the interference of the backscattered probe beam and the appropriate Doppler-shifted reference beam, is detected by the New Focus™ photoreceiver. Each signal is measured using a dual-phase lock-in amplifier array. The true magnitude of the heterodyne signal is displayed on an oscilloscope or recorded by a computer. With the high sensitivity afforded by heterodyne technique, the full spectral response of field-based LSS would offer a means to resolve features of a spherical scatter, such as cell nuclei, that are considerably small than an optical wavelength. This technique will provide a useful tool for in vivo diagnosis of precancerous changes in the epithelium.

Optical Coherence Tomography

Optical Coherence Tomography (OCT) is a promising new class of diagnostic medical imaging technology that utilizes advanced photonics and fiber optics to obtain high-resolution, cross-sectional tomographic imaging of the internal microstructure in highly scattering media, e.g., biological tissue. The OCT technique is done by measuring the time delay and magnitude of optical echoes at different transverse positions. OCT systems have an advantage over competing in vivo techniques, such as high frequency ultrasound, since it offers a higher resolution. Furthermore, OCT can perform both spectroscopic and polarization imaging, to better evaluate the composition of tissues and lesions. OCT was first demonstrated in 199111. Since then, a lot of effort has been put into the improvement of the system. Showing in Figure 6 is a simple OCT system studied by Risø National Laboratory in Denmark12. The OCT system depends on the broad light-spectrum of the source that makes the mm-resolution possible. In this case, a super-luminescent diode (SLD) with a center wavelength of 1545 nm and a spectral linewidth of 59 nm is used. As shown in Figure 6, the low-coherence light of source is coupled into a single-mode fiber-optic Michelson interferometer. Light exiting the sample arm fiber is focused into the specimen being measured. Light retro-reflected from tissue structure is combined in the fiber-optic 50/50 beamsplitter with light from a scanning reference mirror. The noise is a key parameter in achieving high resolution and large penetration depth in OCT. By using interferometer with balanced detection, the excess intensity noise of the light will be suppressed. In order to use a balanced system, two more beamsplitters are incorporated to introduce double detections, as shown in Figure 7. The isolator between K1and K2 beamsplitters is necessary to ensure that power, coupled back from the reference mirror, is not coupled back through K1 to the detector, thus, increasing shot noise and beat noise. The splitting ratio of K3 beamsplitter is selected as 50/50, which has to have this value in order to assure that the intensity noise is suppressed. In addition, a 3 dB attenuator could be added in one detector arm, since it would improve the detection efficiency (Note: the common-mode rejection is maximized when the power in the reference input of the detector is two times that in the signal input13). Please note that the detector used in this case is a New Focus™ Model 2017 Nirvana™ auto-balanced photoreceiver. Since the OCT system is based upon coherence measurements, signals are only detected when the optical path length difference between the sample and reference arms is within the coherence length of the source. Thus, if a difference in the refractive index in the sample causes light to be reflected, the detector will see an interference signal. In general, a wider linewidth of the light source gives a shorter coherence length. For a light source having a Gaussian spectrum, the coherence length is defined as.

where lc is the coherence length, λ0 is the center wavelength, and Δλis the FWHM spectral linewidth. Since the coherence length is a measure of the width of the signal envelope, it determines the longitudinal (depth) resolution of an OCT image. The lateral resolution of an OCT image is determined by the spot size of the sample beam at the depth being probed in the tissue. In a random medium like tissue, it is necessary to take the scattering of the light into account when determining the spot size. While OCT has the potential to be used for a variety of medical applications, cancer and heart disease represent two of the most pressing, and promising application areas. For a review of the biomedical and clinical applications of OCT, please refer to reference 14.

The balanced OCT system with balanced photoreceiver
Figure 7. The balanced OCT system with balanced photoreceiver.

Coherent Optical CDMA

Historically, there are three types of optical code-division multiple-access (O-CDMA) techniques developed at Bellcore in the late 1980s and early 1990s:

  1. Fiber-optic CDMA employing optical orthogonal codes (a spread-spectrum technique)
  2. Femtosecond CDMA (a spread-time technique)
  3. Holographic CDMA (a spread-space technique)

We will focus on the first item only, hereafter referred to as O-CDMA. The current favorite industrial multiplexing scheme for optical communications is wavelength division multiplexing (WDM), yet O-CDMA can offer several distinct advantages for a computer network environment. O-CDMA was designed to be a multiple access protocol that takes advantage of excess bandwidth in single-mode optical fiber. O-CDMA provide asynchronous access to a network, enhanced privacy against interception, efficient utilization for the time and frequency by each user, and simplified network control. O-CDMA systems are normally classified as incoherent15 and coherent16. The incoherent approach utilized unipolar (0/1) codes, matched filtering, and direct detection. The coherent method makes use of the wavelike nature of light, and by impressing phase information, produces bipolar (+1/-1) coding, and hence, an improvement in the processing gains.

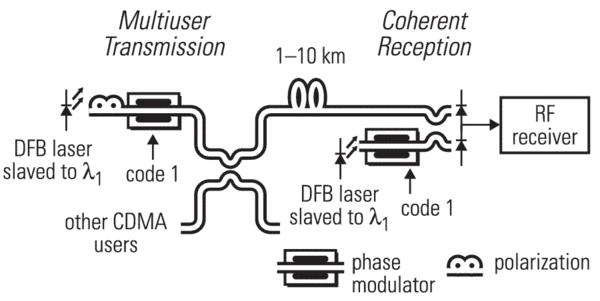
Unlike a direct detection scheme, a coherent detection technique combines the received signal with a signal that is locally generated, and then processes the combined signal. Shown in Figure 8 is a coherent O-CDMA system17. A high quality reference laser is centrally located and individual users use this reference for injection locking of inexpensive DFB lasers to: 1) act as a source for transmission, and 2) serve as LO laser for coherent detection. In coherent lightwave systems, the information signal can be transmitted through amplitude, frequency, and phase modulation of the optical carrier wave, based on the following digital modulation schemes: 1) amplitude shift keying (ASK); 2) frequency shift keying (FSK); and 3) phase shift keying (PSK). In current example as indicated in Figure 8, external phase modulators are used. Data is phase modulated by a bipolar (+1/-1) code and transmitted over the network. At the receiver end, a DFB laser is slaved to the reference laser, phase-modulated by the original bipolar code, and then, combined coherently with the received CDMA signal. The shot noise due to the LO laser is strong enough to overwhelm the other noise terms in the receiver. Using balanced photoreceivers in O-CDMA systems can solve this relative intensity noise problem.

Summary

In this application note we have reviewed several balanced photodetection techniques and how they aid in time-resolved pump-probe measurements, ultrasound measurements, trace gas sensing, infrared transition spectrum detection, light scattering spectroscopy, optical tomography, and optical communications. System performance and sensitivity is greatly enhanced by using balanced photoreceivers and can allow detection of signals which may be impossible to detect with other means.

Coherent CDMA system using a PSK modulator
Figure 8. Coherent CDMA system using a PSK modulator.

References

  1. P.C.D. Hobbs, “Shot noise-limited optical measurements at baseband with noisy lasers,” in Laser Noise, R. Roy, ed., Proc. SPIE 1376, 216-221 (1991)
  2. K.L. Haller and P.C.D. Hobbs, “Double beam laser absorption spectroscopy: shot noise-limited performance at baseband with a novel electronic noise canceller,” in Optical Methods for Ultrasensitive Detection and Analysis: Techniques and Applications, B.L. Fearey, ed., Proc. SPIE 1435, 298-309 (1991)
  3. P.C.D. Hobbs, “Ultrasensitive laser measurements without tears,” Appl. Opt. 36, 903-920 (1997)
  4. C. Thomsen, H.J. Maris, and J. Tauc, “Picosecond acoustics as a non-destructive tool for the characterization of very thin film,” Thin Solid Films 154, 217-223 (1987)
  5. J. Vollmann, D.M. Profunser, and J. Dual, “Sensitivity improvement of a pump-probe set-up for thin film and microstructure metrology,” Ultrasonics 40, 757-763 (2002)
  6. R. Claps, F.V. Englich, D.P. Leleux, D. Richter, F.K. Tittel, and R.F. Curl, “Ammonia detection by use of near-infrared diode-laser-based overtone spectroscopy,” Appl. Opt. 40, 4387-4394 (2001)
  7. M.E. Webber, D.S. Baer, and R.K. Hanson, “Ammonia monitoring near 1.5 µm with diode laser absorption sensors,” Appl. Opt. 40, 2031-2042 (2001)
  8. C.M. Lindsay, R.M. Rade, Jr., and T. Oka, “Survey of H3+ transitions between 3000 and 4200 cm-1,” J. Mol. Spectrosc. 210, 51-59 (2001)
  9. C.S. Gudeman and R.J. Saykally, “Velocity Modulation Infrared Laser Spectroscopy of Molecular Ions,” Ann. Rev. Phys. Chem. 35, 387-418 (1984)
  10. C. Yang, L.T. Perelman, A. Wax, R.R. Dasari, and M.S. Feld, “Feasibility of field-based light scattering spectroscopy,” J. Biomedical Opt. 5, 138-143 (2000)
  11. D. Huang, E.A. Swanson, C.P. Lin, J.S. Schuman, W.G. Stinson, W. Chang, M.R. Hee, T. Flotte, K. Gregory, C.A. Puliafito, and J.G. Fujimoto, “Optical coherence tomography,” Science 254, 1178-1181 (1991)
  12. M.H. Frosz, M. Juhl, and M.H. Lang, “Optical coherence tomography: System design and noise analysis,” A report of Risø National Laboratory, Risø-R-1278(EN) (2001)
  13. New Focus™, Inc., “Nirvana™ auto-balanced photoreceivers, Model 2007 2017 user's manual”
  14. J.G. Fujimoto, C. Pitris, S.A. Boppart, and M.E. Brezinski, “Optical coherence tomography: An emerging technology for biomedical imaging and optical biopsy,” Neoplasia 2, 9-25 (2000)
  15. I. Andonovic and L. Tancevski, “Incoherent optical code division multiple access systems,” in Proc. IEEE Conf. ISSSTA, 424-430 (1996)
  16. M.E. Marhic, “Coherent optical CDMA networks,” J. Lightwave Technol. 11, 854-863 (1993)
  17. F. Ayadi and L.A. Rusch, “Dual balanced detection for coherent optical CDMA with limited phase excursion,” in Proc. 30th Conf. on Information Science and Systems, Princeton University (1996)