Solar Cell Characterization
There are five primary electrical performance parameters used to characterize and compare solar cells:
- Short-circuit current (Isc)
- Open-circuit voltage (Voc)
- Maximum power point (Pm)
- Fill Factor (FF)
- Power Conversion Efficiency (PCE)
The challenge in obtaining reliable measurements lies in establishing standard testing conditions, knowing the actual test conditions, and accounting for all sources of error to express parameters with associated measurement uncertainties.
Updated: 3/25/2026
Standard Solar Cell Test Conditions and Tolerances
Standard test conditions use an AM1.5G spectrum, a cell temperature of 25°C, and an irradiance of 1000 W/m2 (1 Sun). These reference conditions and spectra are defined by reference standards and reference spectra. Typical manufacturing and test tolerances for reporting may follow industry standards (see IEC 60904-3).
Key Solar Cell Characterization Parameters
| Parameter | Symbol | Description |
|---|---|---|
| Short-circuit current | Isc | Current with cell shorted, V = 0 |
| Open-circuit voltage | Voc | Voltage with no load, I = 0 |
| Maximum power point | Pm | Point (I,V) where I×V is maximum |
| Fill Factor | FF | FF = Pm / (Voc × Isc) |
| Power Conversion Efficiency | PCE | PCE = Pm / (Em × Area), where Em is measured irradiance at the cell plane |
Solar Cell Measurement Process (Typical)
- Mount device under test on a temperature-controlled chuck.
- Illuminate with a calibrated solar simulator at AM1.5G, 1000 W/m2.
- Stabilize cell temperature to 25°C
- Sweep voltage with a programmable load or source and record I–V points.
Plotting the measured photocurrent against the bias voltage generates the characteristic I–V curve used to extract the parameters.
Deriving Performance Parameters from the I-V Curve
- Isc and Voc, obtained from the curve intercepts, are commonly found using least-squares fits to reduce noise.
- Pm, located where d(I×V)/dV = 0, is often found by fitting a polynomial to the power versus voltage curve.
- FF = Pm / (Voc × Isc).
- PCE = Pm / (Em × Area), using measured Em at the device plane
For research purposes, PCE is the primary parameter of interest. For solar cells used as irradiance sensors, Isc is the most critical parameter.
Sources of Measurement Error
Common error sources to quantify and report:
- Irradiance and spectral mismatch between simulator and AM1.5G
- Cell temperature deviations and thermal gradients
- Shunt and series resistance effects
- Measurement instrumentation error (current, voltage, timing)
- Nonuniform illumination and beam collimation
The best practice is to report measured Em, cell temperature, spectral match, and estimated uncertainty for each parameter.
Checklist for Repeatable Solar Call Characterization Results
- Calibrate irradiance at the cell plane and report Em.
- Measure and control cell temperature, report the value.
- Use uniform, collimated illumination and record spectral match data.
- Sweep voltage slowly enough to avoid capacitive transients.
- Fit data to reduce noise and compute uncertainty for reported parameters.
Solar Cell Testing and Characterization Solutions
Newport offers predesigned solutions and systems for photovoltaic solar cell testing, including:
- Quantum efficiency systems, measuring EQE/IPCE and IQE, including light source, monochromator, detectors, and automation.
- I–V test stations, automating voltage sweeps and computing Isc, Jsc, Voc, FF, Pm, and PCE.
- Solar simulators, designed for spectral match, uniformity, and collimation.
Quantum Efficiency Measurement
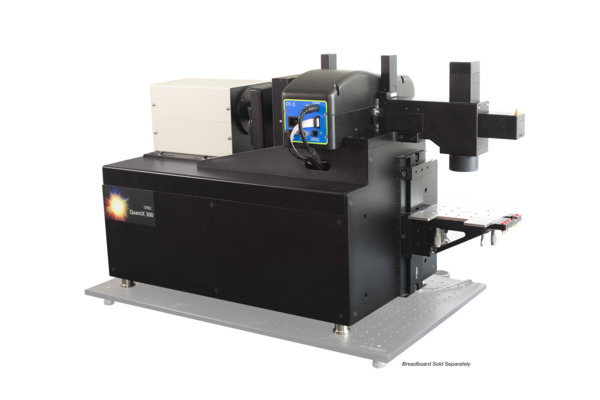
Newport's Quantum Efficiency Measurement Solutions enable the measurement of Internal Quantum Efficiency (IQE) and External Quantum Efficiency (EQE), also known as Incident Photon to Charge Carrier Efficiency (IPCE). These turn-key systems include an integrated light source, monochromator, detectors, electronics, software, and a computer.
Photovoltaic Cell I-V Testing

Newport's Photovoltaic Cell I-V Test Stations perform I-V measurements and calculate critical parameters such as:
- Short circuit current (Isc)
- Current density (Jsc)
- Open circuit voltage (Voc)
- Fill factor (ff)
- Maximum output power (Pmax)
- Cell efficiency (η)
These stations are compatible with all Oriel solar simulators.
Solar Light Simulation
Newport's Solar Simulators provide a close spectral match to the solar spectrum. Key design features include:
- A Xenon arc lamp for a spectrum similar to a 5800 K blackbody.
- Low F/# collection geometry.
- Optical beam homogenization and filtering.
- Collimation to simulate the direct terrestrial beam.
The simulator produces a continuous output with a solar-like spectrum in a uniform, collimated beam.
Resources
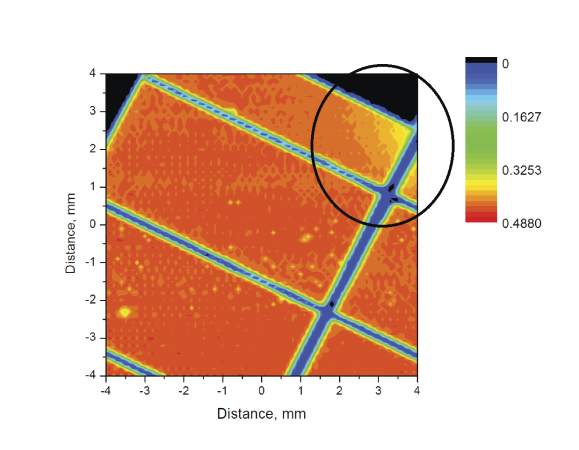
Photovoltaic Instruments Selection Guide(7.5 MB, PDF) Photoresponse Mapping of Photovoltaic Cells(5.4 MB, PDF) Photovoltaic Energy Conversion Solar Light Simulation Solar Panel Manufacturing Photovoltaics Manufacturing Solutions Reliable Solar Cell Measurements(511.3 kB, PDF) How To Minimize Measurement Errors In Solar Cell Testing - Solar Industry(1.2 MB, PDF)